A
AIA CES Credits
AV Office
321M Fayerweather Hall
Abstract Publication
415 Avery Hall
Academic Affairs
400 Avery Hall
Academic Calendar, Columbia University
Academic Calendar, GSAPP
Admissions Office
407 Avery Hall
1172 Amsterdam Avenue
New York, New York 10027
Advanced Standing Waiver Form
Must be printed and returned to 400 Avery Hall
Alumni Board
Alumni Office
405 Avery Hall
1172 Amsterdam Avenue
New York, New York 10027
Architecture Studio Lottery
Assistantships
Avery Library
300 Avery Hall
1172 Amsterdam Avenue
New York, NY 10027
Avery Review
Avery Shorts
B
Black Student Alliance at Columbia GSAPP
Building Science & Technology Waivers
Bulletin Archive
C
Career Services
300M Avery Hall
Columbia Books on Architecture and the City
Commencement
Communications Office
415 Avery Hall
Conversations podcast
Counseling and Psychological Services
Courses
Credentials Verification
Credit Transfer
Cross Registration
D
Dean’s Letter
Dean’s Office
402 Avery Hall
1172 Amsterdam Avenue
New York, NY 10027
Development Office
404 Avery Hall
Directory of Classes (All Columbia University)
Disability Services
Dodge Fitness Center
3030 Broadway Dodge
Dual Degree Program Requirements
E
End of Year Show
Events Office
415 Avery Hall
External Funding Sources
F
Faculty Directory
Feedback
Finance Office
406 Avery Hall
Fitch Colloquium
Future Anterior Journal
G
GSAPPX+
Grades
Graduation
Graphics Project
H
Honor System
Human Resources
Hybrid Pedagogy Resources
I
IT Helpdesk Ticket, GSAPP
IT Office, GSAPP
IT, Columbia University (CUIT)
Identity
International Students and Scholars Office (ISSO)
N
News and Press Releases
Newsletter Sign Up
Non-Discrimination Statement and Policy
O
Onera Prize for Historic Preservation
Online Admissions Application
GSAPP Admissions 407 Avery Hall
Output Shop
116 Avery Hall
1172 Amsterdam Avenue
New York, NY 10027
Ownership of Student Work Policy
P
Paris Prize, Buell Center
Paul S. Byard Memorial Lecture Series
Percival & Naomi Goodman Fellowship
Plagiarism Policy
Policies & Resources
Press Releases
Publications Office
415 Avery Hall
1172 Amsterdam Avenue
New York, New York 10027
R
Registration
Registration: Add / Drop Form
Room Reservations
S
STEM Designation
Satisfactory Academic Progress
Scholarships
Skill Trails
Student Affairs
400 Avery Hall
Student Awards
Student Conduct
Student Council (All Programs)
Student Financial Services
Student Health Services at Columbia
Student Organization Handbook
Student Organizations
Student Services Center
205 Kent Hall
Student Services Online (SSOL)
Student Work Online
Studio Culture Policy
Studio Procedures
Summer Workshops
Support GSAPP
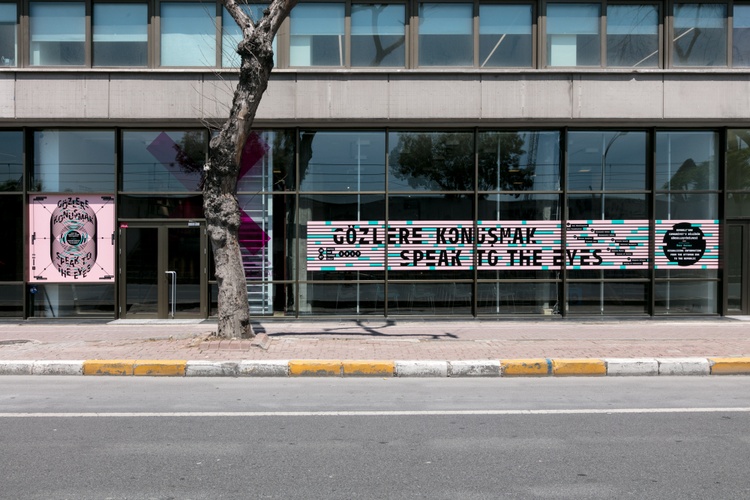
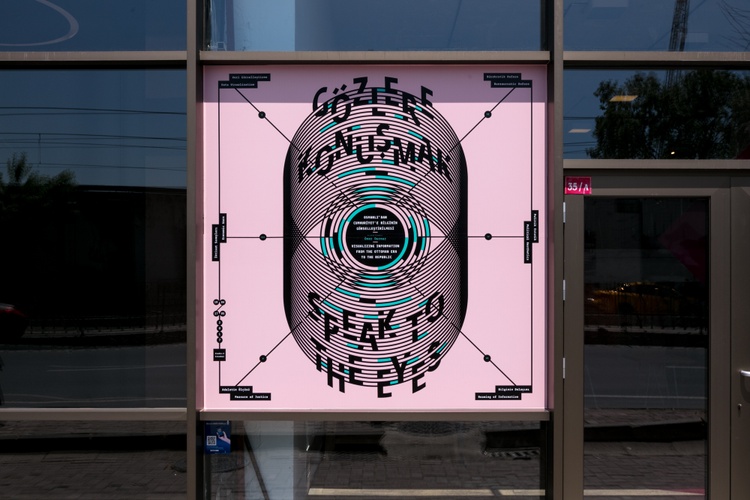

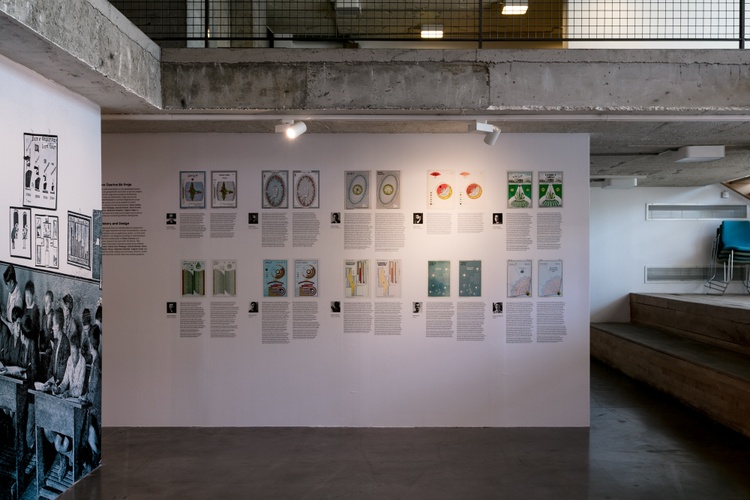


Visualizing Information from the Ottoman Era to the Republic
“The best way to capture imagination is to speak to the eyes.”
William Playfair*
The information highways brought into our lives by a rapidly developing technology, transformed information into a web that is commonly known as “bigdata”**. Systems designed to store and process large volumes of data also changed the methods to get access to and present information. This enormous momentum gave prominence to academic fields, which document and archive information as well as enabling it to read past data. One of these is a multidisciplinary academic field, namely “informational design”. Although informational design which visualizes information effectively was greeted with enthusiasm as an emerging field of expertise, the background of the subjects that constitute this field has deep roots in history. We now know that, long before the bigdata came into our lives, the power of visualization that rapidly captures the eye and makes the content easily comprehensible was utilized for systematic approaches to information.
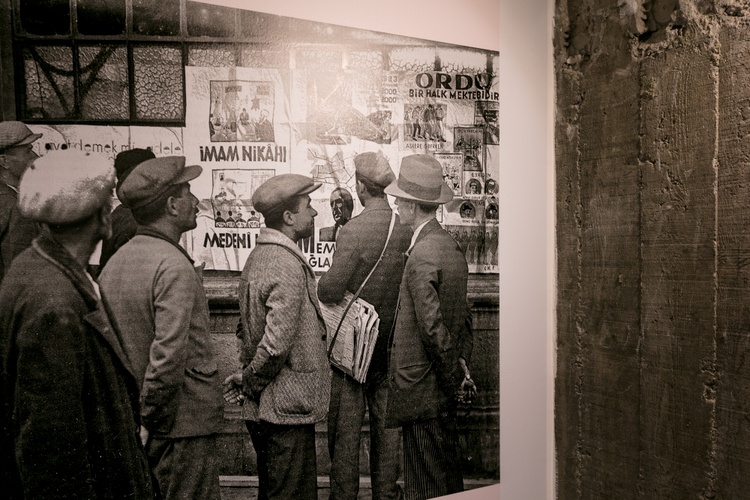
The research exhibition “Speak to the Eyes” studies information visualization with a specific focus on the Late Ottoman and the Early Turkish Republic periods while also taking into account the history of informational design in the West. The research documents that as a method “graphics” were used deliberately and long before than commonly assumed for circulating and relaying quantitative information. The research also evaluates the consequences of these findings for the history of design.
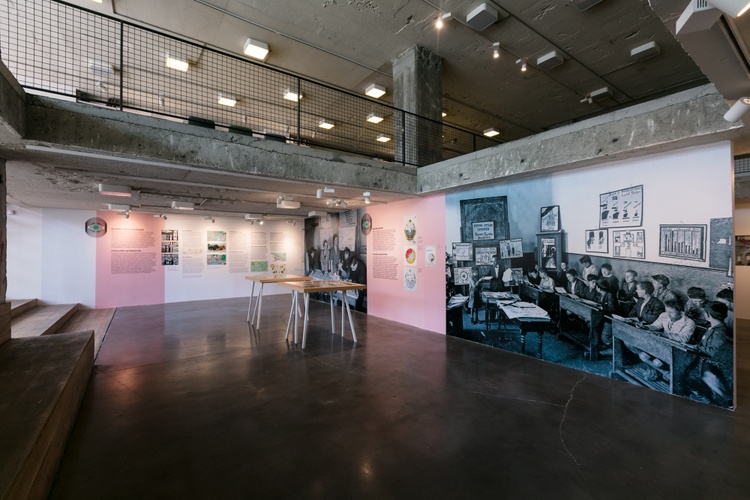
The research was summarized and turned into an exhibition under seven headings: “Visualizing Information” approaches the subject from a universal perspective and sets the research framework by introducing basic definitions. “Adedî Grafik Sûret-î Mütalâası [Methods of Reading Numerical Graphics] or Data Visualization” mainly focuses on the period 1910-1950 and evaluates the development of local vocational terminology and related vocational skills. In order to provide an insight for historical research, this section also addresses previous periods.
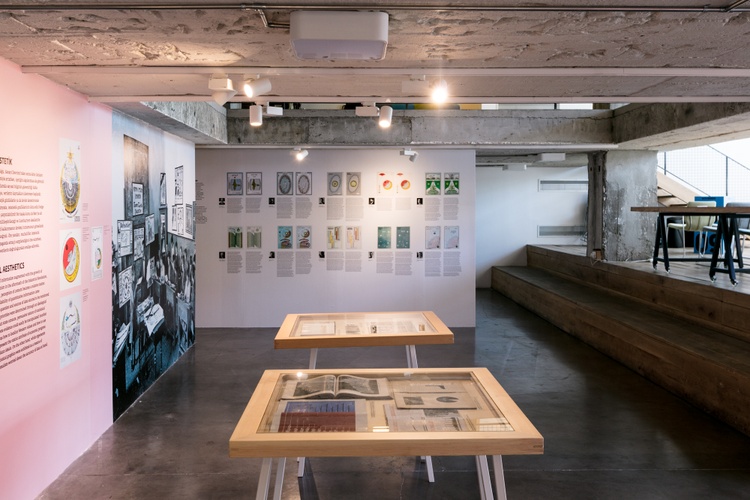
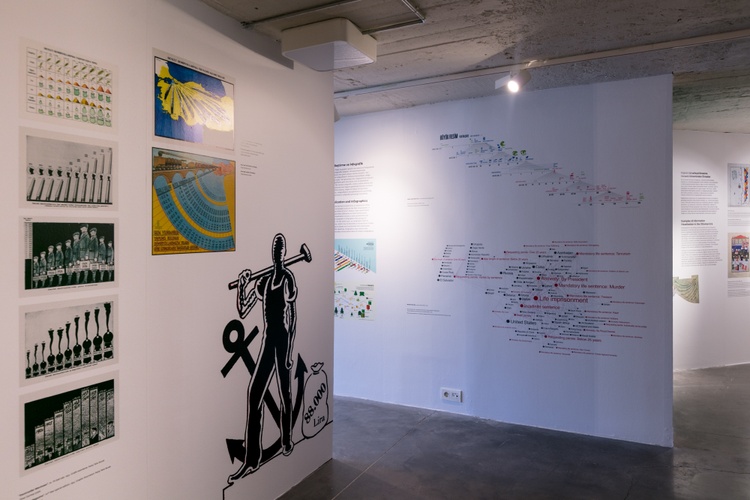
“Bureaucratic Reform” and “Economics Wars” sections analyze the principal demands by which the subject emerged as well as the dynamics that shaped this process. “Political Aesthetics” section discusses the transformation of this issue into a propaganda tool for the political regime.
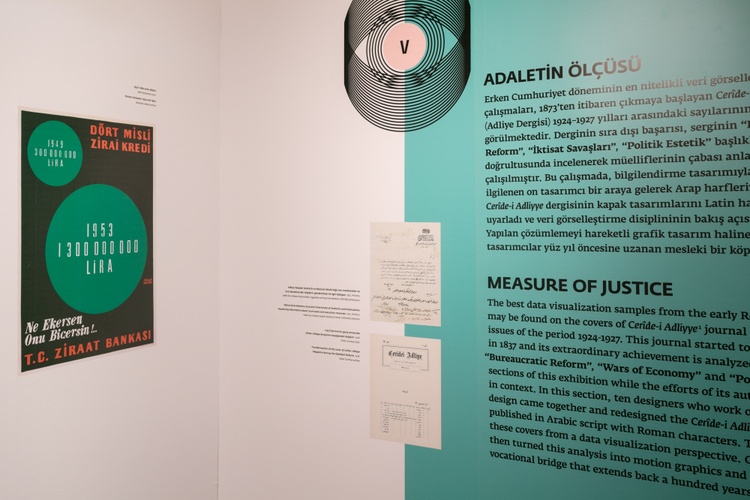
“Measure of Justice” studies the journal, Ceride-i Adliye [The Judiciary Journal], which used outstanding examples of data visualization on its cover during the 1920s and aims to understand the journal’s editors’ efforts. In this exciting section of the exhibition, ten designers who work as informational designers came together and built a vocational bridge that extends back a century. They took the cover designs of Ceride-i Adliye journal published in Ottoman Turkish with Arabic scripture and adapted them to current day Turkish. They then turned these into motion graphics.
In the last section of the exhibition titled “Roaming of Information”, data visualization and infographics representations in daily life and in the communication sphere are displayed through various examples.
—Ömer Durmaz
Curator: Ömer Durmaz
Exhibition and Identity Design: Erman Yılmaz, Sarp Sözdinler
Contributing Designers: Anıl Yanık, Barış Atiker, Burak Arıkan, Daniele Savasta, Deniz Cem Önduygu, Emrah Kavlak, Emre Parlak, Gökhan Ersan, Mahir Yavuz, Mehmet Gözetlik, Refik Anadol, Tuğcan Güler, Ziyacan Bayar
Academic Advisory Committee: Emin Nedret İşli, Gökhan Ersan, İlhan Bilge, Mehmet Ö. Alkan, Murat Güvenç, Özlem Özkal, Sadık Karamustafa, Tuğcan Güler
Editorial Contribution: Aybala Yentürk, Şerafettin Dedeoğlu, Fatih Çil, Fatih Dalgalı, Cengiz Kahraman, Ömer Faruk Şerifoğlu
Translated by: Elvan Kıvılcım
Printing: 3T Reklam, A4 Ofset
Acknowledgements: Ahmet Priştina Kent Arşivi ve Müzesi (APİKAM), Anadolu Medeniyetleri Araştırma Merkezi (ANAMED), Atatürk Kitaplığı, Denizler Kitabevi, Ege Sevinçli, Elif Kocabıyık, Dokuz Eylül Üniversitesi Güzel Sanatlar Fakültesi, Esen Karol, Feza Günergun, Gökhan Akçura, Hasan Mavi, İstanbul Araştırmaları Enstitüsü ve Suna Kıraç Kütüphanesi, Iraz Geray, İstanbul Üniversitesi Nadir Eserler Kütüphanesi, Liz Erçevik Amado, Lorans Tanatar Baruh, Milli Kütüphane, Nejat Yentürk, Osman Tülü, SALT Araştırma, Selva Gürdoğan, Studio-X Istanbul, Şaban Özdemir, Şükrü Oral, Sinan Çuluk, Tasarım ve Tasarım Tarihi Topluluğu (4T), Tofaş Bursa Anadolu Arabaları Müzesi, Uğur Kavas, Volkan Ekşi, Vehbi Koç ve Ankara Araştırmaları Merkezi (VEKAM)
*The work of the engineer and economist William Playfair from 1780s onwards is information visualization par excellence. Large amounts of data became relatively easy to conceive with this method. What this actually meant was that the data gathered through statistics was transformed into an ‘observable’ state by acquiring volume and movement. The first known time, bar and pie chart graphics were used in Playfair’s “The Commercial and Political Atlas” which was published in 1786.
** “Big data”: defines big volumes of data that is created by congregation of data clusters too large and complicated to be processed by existing information technologies. They are composed of large volumes of data, high speed data production and information with a high data variability. Depending on how valuable the data is, they support advanced decision making processes in various sectors and fields and are used for data interpretation and process optimization.

End of Year Show
Avery Hall

End of Year Show 2026
1172 Amsterdam Ave, New York, NY 10027